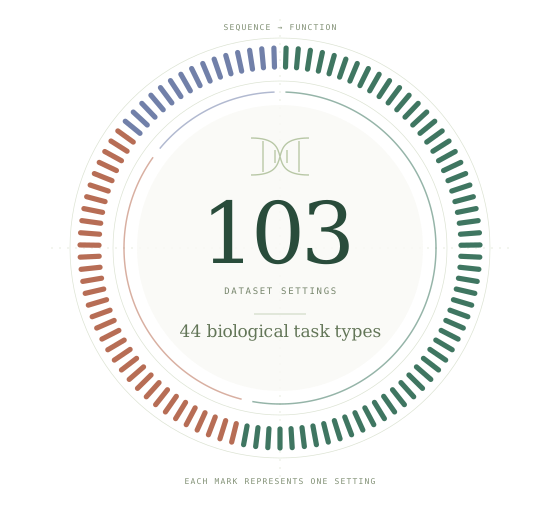
Genomic Touchstone evaluates genomic language models in the context of the central dogma. Across 44 tasks and 103 dataset settings, it tests how representations learned from DNA support prediction of RNA function and protein properties.
The benchmark assesses how DNA-pretrained representations support sequence-dependent functions and properties across DNA, RNA and protein biology. Human tasks are complemented by data from other species, engineered sequences and in vitro experimental systems.
01 / DNA
DNA function & regulation.
Genomic function annotation, regulatory mechanism modeling and genetic variant effect prediction: from recognizing functional elements to predicting gene regulation and the consequences of sequence variation.
20 task types55 settings
02 / RNA
RNA function & regulation.
RNA functional studies, post-transcriptional regulation and RNA engineering applications test whether DNA-pretrained models can transfer to RNA-level prediction without explicit RNA pretraining.
13 task types33 settings
03 / PROTEIN
Protein structure & function.
Structural analysis and prediction, protein functional annotation and protein property prediction assess how much protein-level information genomic models can recover from coding DNA sequences.
11 task types15 settings
The study comprises 44 tasks across 103 dataset settings: 100 main settings and three separate long-range DNA settings. Settings include different input lengths, sources and split protocols; they are not all independent data sources.
02 / THE LEADERBOARD
Model rankings, across biological tasks.
The main comparison evaluates 43 nucleotide-input models across 100 settings, using full fine-tuning of pretrained models and supervised baselines trained from scratch. Mean within-setting ranks summarize performance overall and by biological task category.
FINE-TUNING43 models · 100 main settingsRESULTS SNAPSHOT
Mean rank across 100 settings · lower is better
RANKS BY TASK CATEGORY
Model rankings across DNA, RNA and protein.
Lower mean rank is better ↓
Hover, focus or tap a cell to see its mean rank and task category.
No matching models. Clear the model search to restore the heatmaps.
Models are ordered independently within each modality. Every cell shows its mean rank; darker colors are better. Overall averages all settings, while the other columns summarize task categories. Hover or tap for precise values. Swipe between panels on mobile; use arrow keys to explore cells.
Fine-tuning leaderboard: average rank across 100 settings
Rank
Model
First public
Published in
Mean rank ↓
Seed SD
Loading the leaderboard…
Loading results…
Each setting contributes equally. Model search preserves the full-cohort ranks. Dates mark the cited paper’s first public version, including preprints; venues identify the cited publication. Baselines use their reference papers.
How to read these results +
Comparable ranks, different metrics.
Models are ranked within each setting using full-precision accepted mean scores: AUPRC for classification and Spearman correlation for regression, both higher is better. Exact ties receive average ranks. Aggregate ranks average those setting ranks with equal weight, then order them from lowest to highest.
A defined comparison.
The main comparison includes 52 DNA, 33 RNA and 15 protein settings. All 43 models use nucleotide inputs; protein-related tasks use coding DNA sequences. Linear probing, the three dedicated long-range settings and separate task-specific reference evaluations are reported outside this cohort.
Keep the protocols in view.
Accepted historical learning-rate, seed and precision choices are retained; some were informed by test results. Seed SD describes the accepted repetitions, not a confidence interval. Settings include related datasets and split protocols. Select a setting and a model to inspect its recorded qualifications.
This website shows the current 100-setting main comparison. Its protein panel includes 15 settings for nucleotide-input models; the manuscript also reports a separate comparison with protein language models on 14 shared settings. Download scores, seeds, protocol notes and source hashes ↗
MODEL SCALE
Scaling law.
The study examines how model size and pretraining data relate to downstream performance. Larger models show an overall positive association with performance, with substantial variation among models of comparable size.
39 models · 98 settings · 11 fit representativesScroll to inspect labels, or open the full figure.
This is the study’s 98-setting analysis snapshot. The vertical axis averages classification AUPRC and regression Spearman scores with equal weight per setting. The selected-model fit describes an association across architectures and training data. Download plotted data ↗
The study profiles inference and full fine-tuning memory for 39 nucleotide-sequence models on a single NVIDIA H800 (80 GB), at batch size 1. Use these measurements to explore sequence-length costs; the website additionally estimates larger batches and GPU capacity requirements.
39 modelsNVIDIA H800 · single GPUBatch size 1Measured 15 Oct 2026 and earlier
Loading resource measurements…
Nucleotides before padding. Intermediate lengths use local interpolation between successful measurements; no extrapolation.
Main result: the entire batch on one GPU. Recommendations split it evenly across up to 8 GPUs.
MeasuredOut of memoryInput length unsupportedNot measured
Which GPUs could fit?
Capacity planning · not a speed or compatibility benchmark
GPU / vendor memory
Budget per GPU
Suggested replica plan
Training alternative
Budget = vendor GB × 10⁹ / 2³⁰ × (1 − headroom). This deliberately conservative conversion is a planning convention, not measured CUDA free memory. H100 SXM 80 GB and NVL 94 GB are per GPU. Check actual device availability and the model’s kernels before deploying.
Batch 1 at a recorded length is measured. Other values are uncalibrated planning estimates: M(B, L) ≈ F + B × [M(1, L) − F]. Inference uses loaded memory for F; PyTorch training uses the minimum observed post-warmup baseline, including initialized optimizer state. AlphaGenome training uses a separate, lower-confidence parameter-storage proxy. Gradients and workspaces in the remainder may be over-scaled. Headroom is user-selected reserve, not a confidence interval or a guarantee.
Estimation assumptions & multi-GPU limits
Length interpolation is linear in input nucleotides between adjacent successful records no more than 2× apart. It never crosses an OOM or unsupported record, and never extrapolates beyond measured coverage. Tokenization, padding, sequence content and kernel choices can make actual memory nonlinear. Larger batches have not been measured. AlphaGenome uses a low-confidence approximation: inference holds measured loaded memory fixed; training holds only the recorded parameter-storage bytes fixed. Optimizer, compilation and workspace memory therefore remain in the batch-scaled remainder and may cause substantial overestimation. This is a rough scenario, not a validated upper bound; larger batches have not been measured.
Each inference replica or training data-parallel worker holds the full model. Additional cards split the batch, not the model’s memory. Card counts use equal per-GPU batches and include up to 8 devices. Training may instead use gradient accumulation: effective batch = per-GPU microbatch × GPU count × accumulation steps. Accumulation changes execution time and can change batch-dependent model behavior; distributed communication adds overhead. If a single sample cannot fit, model/sequence sharding or a different precision is needed; this dataset cannot determine that card count.
PyTorch values are allocated peaks after warmup and exclude allocator reserves and other device allocations. AlphaGenome uses a different JAX peak scope. The source is single-H800, batch-1 measurements in the study’s original precision. These estimates do not validate software support on RTX 3090/4090/5090 or H100. Evo2’s required FP8 path is excluded on RTX 3090. The resource cohort contains 39 nucleotide models and differs from the 43-model ranking. No new GPU measurements have been run.
Explore 44 prediction tasks organized into nine biological categories across DNA, RNA and protein. Each task describes the prediction target and its biological significance using excerpts from the manuscript’s Results and Methods.
Loading task catalogue…SELECT A TASK FOR ITS BIOLOGICAL CONTEXT
Loading the task collection…
100 main settings + 3 long-range settings
01 / 01
04 / THE MODEL LIBRARY
Models & methods. Architectures to resources.
The study evaluates 63 models and reference methods: genomic, RNA and protein language models, task-specific predictors, conservation-based methods and supervised baselines. Compare their specifications and access the cited papers and released resources below.
Scroll horizontally to compare specifications. Model names and resource links stay in view.
Loading model resources…
Specifications follow the manuscript’s model table. Input length is in nucleotides (nt) for DNA/RNA models and amino acids (aa) for protein models; variable and task-dependent lengths are retained as reported. These are model specifications; measured memory coverage is shown in the GPU explorer. M/B = million/billion parameters; ≈ = approximate; — = not applicable or not specified. MLM = masked language modeling; NTP = next-token prediction; SAL = structural alignment learning.
Sources follow the manuscript’s model table and references, with checkpoint links resolved from the cited releases. FT = fine-tuning; LP = linear probing; Fixed = evaluation without downstream training. Modes apply to each model’s task subsets. Scratch baselines provide code; conservation methods and precomputed predictions are labeled separately. This directory includes models beyond the 43-model main leaderboard.
05 / EVALUATION WITH CONTEXT
From pretrained models to biological prediction.
The main comparison adapts pretrained models through full-parameter fine-tuning alongside baselines trained from scratch. Linear probing and task-specific references provide complementary evaluations within their applicable task subsets.
01
Define the biological target.
Tasks specify the prediction target, input representation and data splits. Related genes, sequences or experimental families are grouped according to each task’s protocol to reduce information leakage.
BIOLOGICALLY GROUNDED TASKS02
Adapt the full model.
Full fine-tuning updates the pretrained backbone and a task-specific prediction head. CNN, LSTM, Basic Transformer and CNN-56M baselines are trained from random initialization on each downstream dataset.
FULL-PARAMETER FINE-TUNING03
Probe representations and references.
Linear probing freezes the backbone and trains a linear head on cached representations. Specialist predictors and conservation-based methods provide task-specific reference evaluations; long-range experiments are reported separately.
COMPLEMENTARY EVALUATIONS
63 MODELS & METHODS
32 Genomic LMs6 RNA LMs11 Protein LMs10 Task-specific methods4 Baselines
06 / GO FURTHER
Paper & evaluation code.
Read the study and access the evaluation code. To propose an additional model for benchmarking, submit its configuration through the project’s GitHub repository.